Introduction
COVID-19 changed the learning method of K-12 schools, which attempted to adapt to the pandemic by adopting online classes. The adaptation of educational changes, such as online classes, has continued since the end of pandemic. The transition of education during the pandemic gave us both difficulty and opportunities for educational development.
Our final project will show how COVID-19 has changed the structure of educational institutions and how students and schools have adapted to the rapidly evolving education industry by analyzing various data. To analyze the research topic “Covid Pandemic Impact on Educational Opportunities,” we set the research questions. For analyzing the research question, “To what extent were racial academic achievement gaps of students grades [K-12] in the United States impacted by their school’s response to COVID-19?” We chose to support this research question by visualizing the data “Educational Impacts of the COVID-19 Pandemic in the United States: Inequities by Race, Ethnicity, and Socioeconomic Status.” Also, even if neglect is a response choice, school’s are still responding to COVID-19, even if it’s different than in 2020 and 2021. In reference to our bibliography, Our team will support this research question using “Potential Socioeconomic Effects of the COVID-19 Pandemic on Neural Development, Mental Health, and K-12 Educational Achievement.” For the research question, “How does the gap in test-based achievement between years pre- and post-COVID pandemic vary between different states and why?” We will use the data that demonstrates how academic achievement differs by state before and after the back-to-normal push of 2021.
Our research is underpinned by a comprehensive analysis of data, supported by a reliable researchs. We collected reliable sources from Jstor, Science Direct, LearnTechLib, ResearchGate which provides the research conducted by NECS, Harvard Graduate School Education, and American Enterprise Institute. To present our findings, we will utilize various visualization tools such as Tableau, arcGIS, on our website. These tools will help us effectively communicate the distribution of academic achievement gaps over time and SES composite scores, instilling confidence in the reliability of our research.
Literature Review
Even though we are still witnessing the consequences of COVID-19, there is already ample literature pertaining to its impact on the American education system. Such scholarly discussions tend to primarily focus on the various ways the pandemic affected students and schools, including dropout rates, mental health, test score performance, children’s neurodevelopment, and quality of courses. The articles “The Impact of COVID-19 on American Education” and “Potential Socioeconomic Effects of the COVID-19 Pandemic on Neural Development, Mental Health, and K-12 Educational Achievement” provide detailed accounts of the effects of the pandemic. There are a number of articles that also explore gaps in educational achievement between various groups, such as race and income level. One could compare the literature surrounding gaps in test score performance with the other ways affected by the COVID-19 pandemic and determine correlations between the two. For example, several researchers observed that students who come from Black or Latinx households overall performed worse on standardized tests post-pandemic than pre-pandemic. Using the literature at hand, one will discern that the reason for this is because they, on average, come from a lower socioeconomic background (Assari, et. al).
A noticeable flaw of the aforementioned literature is that Asian Americans are rarely included in the studies that focus on gaps in educational achievements between racial groups in the United States. A reason for this may be that certain districts often lump Asian American students with White students (Leong 1). This is a dangerous tactic, as Asian Americans make up almost 10% of the population. Only two of the fifteen articles we cited mention Asian Americans in their studies. In a similar vein, students of Native American descent are hardly – if at all – included. Moreover, much of the scholarly work related to COVID-19’s impact on K-12 students and the American education system is still changing, as many institutions are still being affected by the consequences of COVID in 2024. For instance, numerous schools in the United States are still offering online classes or have even gotten rid of the concept of “snow days.” Regarding the latter, instructors hold virtual classes instead. To truly gain a better understanding of our research questions, it would be better to examine data from a 5-10 year interval rather than a three year interval.
Significance
We undertook this project to learn how to build what could hopefully be the beginnings of a resource on educational equity during a pandemic climate and its persisting relevance at the intersection of education and public health policy in the U.S.. We wanted to contribute to these ongoing scholarly discussions while emphasizing this present and unending task. While the test-scores in the data we chose to analyze are one factor in a broad web of the overlapping intricacies that impact students’ quality of life and quality of education, the visual inequities signify deep-seated obstacles in education, including COVID-19 response. The variance in academic performance compared to access to resources and income across states illustrate crucial needs in investment. As the remainder of pandemic aid to schools expires this coming Fall, we are approaching a unique deadline to remedy these effects (Ross, 2024).
While a fifth year of the COVID-19 pandemic continues to permeate every public experience, the ramifications on school-aged children persist as one of the most vulnerable groups affected. This Summer, COVID-19 wastewater data shows community transmission to still be high and very high in 26 states due to the dominant FLiRT variant (CDC, n.d.) and during the school year, “70% of COVID-19 cases are transmitted by [school-aged] children” (Seshadri 2023). The 2020-21 height-of-isolation period of the pandemic and global attention towards the Black Lives Matter movement saw unprecedented accommodations with many schools moving to online/ hybrid formats, as well as efforts towards racial equity and inclusion in K-12 spaces. Following the mass return to in-person instruction in 2021, a lack of structural adjustments towards exposure prevention (i.e. ventilation, masks, vaccine mandates, etc.) (CalMatters), cyclical issues of chronic absenteeism and exacerbated learning loss have proliferated (Anderson, 2024). Further, lessened pressure on racial equity, government rollbacks on pandemic policy, CDC contradictions with WHO to incentivize return-to-work, etc. left previous pressures on racial and socioeconomic equity as an afterthought to the priority to get “back to normal”. Pedagogical theorist Gloria Ladson-Billings, in company with other education scholars, advocates for us to move forward instead of backward, for us to take advantage of the opportunity COVID-19 gave us, to “reset” education and reshape our curriculums, pedagogy, and structures to be equitable for Black and Latine students, for Disabled students, for EB students, that our data are showing are suffering academically in these current systems while they are also suffering disproportionate mortality rates from COVID-19 (Ladson-Billings, 2021).
While the data and literature we’re focusing on primarily concerns itself with learning-loss and demographic gaps in academic achievement, these symptoms go beyond losses or changes in instruction and social time prior to COVID vaccines. Ultimately, we want to understand and help others understand how COVID-19 and its ramifications on the state of education impacts them and their stake in its solvency. Meaningful progress towards educational equity requires holistic investment, from schools, from community members regardless of whether they have children in schools, from districts, from public health infrastructure, from policymakers locally, state-wide, and nationally. Educational institutions are a primary building block in raising the next generations, making it vital that they are places where students are safe and that they are learning. The wellbeing of our youth in schools impacts everyone.
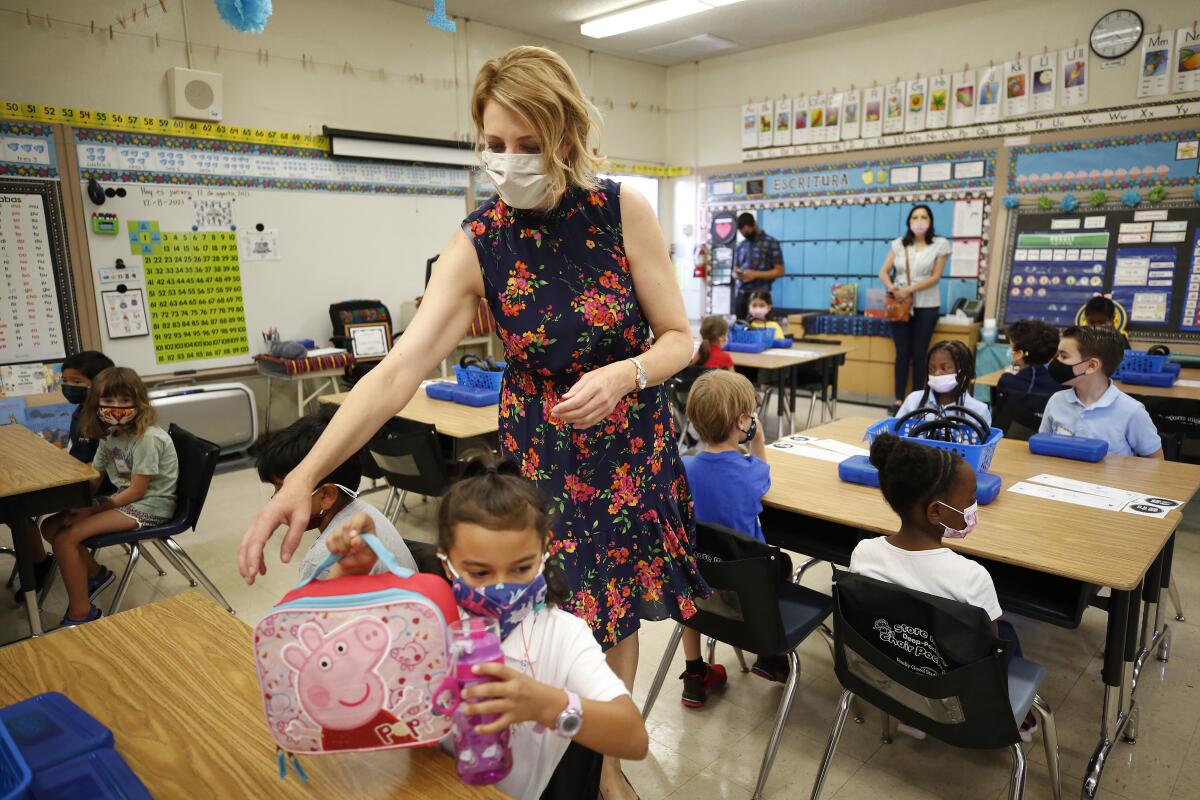
Image 1. Julie Silk works with her kindergarten students in the classroom at Jackson STEM Dual Language Magnet Academy in Altadena. (Al Seib / Los Angeles Times)
To what extent were racial academic achievement gaps of students grades [K-12] in the United States impacted by their school’s response to COVID-19?
Racial Achievement Gaps by Year

Graph 1. Created on Tableau. Shown is a line chart displaying race-achievement gaps (measured by test scores) from 2008 to 2020.
The line chart has different colored lines that represent race-achievement gaps, measured by test scores. We used a line chart to display change over time, and in this case it is the racial-achievement gaps from 2008 to 2020. For white-hispanic gaps, the higher the yellow line is, the more difference there was between hispanic students and white students, with white students generally performing better. This applies to the white-black achievement gap line as well. Notably, Asian-American achievement gaps are negative, showing that they outperformed white students during these years. Part of what makes this chart look slightly separated is the ontology the dataset creators use. Even though Asian students have better academic performance, the creators assume that white students are the norm and label them as white cohort mean, seen in the top green line. At the start of the pandemic, racial achievement gaps generally don’t peak or pitfall, showing that hispanic and black students were not as affected at the beginning of the pandemic. Asian American students still outperformed white students. However, in Goldberg 2021, the increase in anti-Asian racism was shown to affect the performance of asian students. It shows that while the data indicates the initial impact of COVID was minimal, by making the standard white students, the dataset creators mask changes in individual racial groups’ academic performances and do not account as well for circumstances that may affect each group.
Student Access to Free or Subsidized Meals by State

Graph 2. Created on Tableau. Shown is an interactive treemap chart displaying the proportion of students enrolled in either free of reduced lunch by state over the years 2009-2019.
Each nestled rectangle on this treemap displays a different state and its respective proportion of students enrolled in either free or reduced lunch programs. The filter demonstrates the change in proportion of each state by year from 2009-2019, missing data since the beginning of the COVID-19 pandemic in 2020. Rectangles having a greater area and darker shades of blue show higher needs due to the free or reduced lunch program’s proximity to low income and poverty. One of the most prominent concerns regarding socioeconomically disadvantaged students during the early pandemic, alongside drop-out rates and absenteeism, concerned food insecurity, in which less or loss of access to free and subsidized meals due to school closures and online formats (Goldberg, 2021) would inhibit low income students’ performance and engagement to fall further behind their higher-income counterparts that more likely would’ve maintained a steady access to meals and nutrition (Chung & Nari, 2022). Indeed, “ensuring that each child is fed nutritious meals and has adequate exercise increases academic achievement” (George, et. al. 2021). As illustrated on the treemap, a majority of states half approximately half of their students enrolled in these meal programs. D.C. and states like Mississippi, New Mexico, and Louisiana show the most severe needs with over 70% of their students requiring free and reduced meals since 2009, reaching nearly 78% in the few years prior to the beginning of the pandemic. Every single state increased the proportion of students receiving subsidized meals by at least a few percentage points since 2009. Collated to our other data on income and poverty levels in each state, as well as student performance and engagement, we can see that there is a correlation between states that have larger proportions of high-need students and those that have higher performance gaps. Since there is a gap in data on subsidized meal programs since the start of the pandemic, the high proportions of these programs in most states prior to the pandemic calls for a recovery of pandemic data, to help community members and policy makers assess needs and ensure students are maintaining adequate nutrition to succeed in school. The federal CARES Act in 2020 gave schools across the country flexible spending to help stabilize, including for meals for students, the remainder of which expires in Fall. Meal access and food insecurity must be a significant consideration for the appropriation of these funds.
Average Poverty Rates Of Racial Groups
Graph 3. Created on Google Sheets. Shown is a bar chart showing average poverty rates by race in pre-COVID times.
The following bar chart examines the average poverty rate (by percentage) among different racial groups in the United States before the COVID-19 pandemic in 2020. White Americans had the lowest average poverty rate in this decade and Asian Americans had the second lowest average poverty rate. On the other hand, the average poverty rate was the highest among Hispanic Americans and the second highest among Black Americans. Knowing and comparing the average poverty rates between different racial groups can help us infer which ones may have been negatively impacted because of COVID-19. In this case, one can conclude that overall, Black Americans and Hispanic Americans may have scored lower on tests during the pandemic because they generally had less access to the necessary technology for remote learning. Studies like “K-12 Online Learning Issues of Marginalized Populations in the US during the COVID-19 Pandemic” support this claim, as the authors of this article discovered that students from Black and Hispanic households generally had a lower average test score performance during and after the pandemic (Hung et al. 2021).
How and why do the state students live in affect gaps in test-based achievement between years pre- and post-COVID pandemic?
Map of Test Scores (Mean Standard Error)

Map 1. Created on Tableau. Shown is a simple filled (polygon) map for the least cluttered viewing. It depicts the mean standard error of test score achievement between states.
When discussing the effects of COVID-19 on the test-based achievement of K-12 students, it is necessary to consider geographical influences, as each state of the United States of America has had their own laws during the course of the pandemic. When compared to a second map of pre-pandemic mean standard errors in test scores, it becomes more clear the impacts of different laws. For example, increased deviations may suggest that the coronavirus greatly impacted a specific demographic of students. In this visualization, without taking into account any other maps, we can see that the northern midwest has a greater mean standard error than the states around the Four Corners, New England, and Middle Atlantic regions. Large states with much diversity such as California and Texas also have significant mean standard errors.
It is critical to consider the consequences of the COVID-19 pandemic, as it led to a clear increase in inequality in education in many Western countries. A study in Denmark on students in grades K-12 found the greatest inequalities in grades 2 and 3, with “large inequalities in the learning loss based on parental education and parental income, on top of already existing inequalities” (Haelermans et al. 2022, 13).
Geography should be considered when weighing these issues, too, as state level educational policies directly impact students (Burbidge 2002, 236). States with less support for those who are socioeconomically disadvantaged may have greater standard error across-state because marginalized student populations tend to fall behind due to their lack of resources for online and hybrid learning (Chung and Kim 2022, 1).
State Test-Based Achievement Pre- & Post-Pandemic
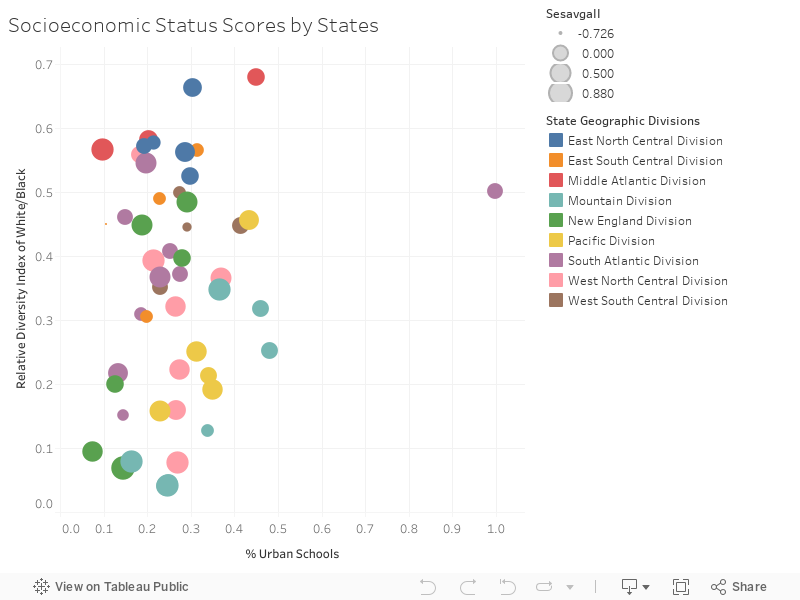
Graph 4. Created on Tableau. Shown is a bubble chart with bubbles representing states, size according to socioeconomic composite scores, and compared on % urbanity and racial diversity.
We used a bubble chart to show the relationship between socioeconomic status (SES), how urban a state is, and racial diversity of the state. The colors of the bubble relate to Census divisions. Each bubble represents an individual state. The size of each bubble relates to the state’s socioeconomic composite score, with a bigger bubble indicating that the state has a higher score (e.g. less poverty, more access to resources, etc). There are multiple bubbles of the same color because the color represents census division. For example, the yellow bubbles represent the states in the Pacific Division: OR, WA, CA, HI, and AK). To look at individual states, you can hover over the bubbles in the chart above. The x-axis represents the proportion of students in city or urban locale schools (urban), and the y-axis represents the relative diversity index between schools of white/black students (rswhtblk). A relative diversity index closer to 1.0 means the state is relatively more diverse/less homogenous, while an urban score closer to 1.0 means the state the bubble represents is more urban. In the bubble chart, states from the East North Central Division (i.e. Illinois, Wisconsin, etc) have similar sized bubbles while states from the South Atlantic Division (i.e. D.C., West Virginia, etc) have more spread out bubbles of different sizes. States from the East North Central Division should theoretically indicate more similar student academic performance than states in the South Atlantic Division as people from those states have more similar backgrounds and culture. The difference in student performance in regions where states are more similar to each other can be explained by factors that aren’t racial diversity and how urban the states are, and allow us to narrow in on other factors that may have affected student performance. States that have smaller SES composites but larger relative diversity indexes, such as those in the south atlantic division, which are the east coast states spanning from DC to Florida, tend to have greater test error gaps post-COVID. Students that are of color and are less well off with less resources perform worse than other students in America. Marginalized students often have less access to materials and other resources, which shows how socioeconomic status has impact on education (Chung & Nari, 2022). States with larger bubbles have mixed diversity, indicating that the factor of race might not be as impactful as socioeconomic status, and urban locale is also mixed as states have different socioeconomic statuses that don’t align with their urban locality. This shows that (1) socioeconomic status greatly impacts educational growth and (2) state legislation is important for student education after the start of the pandemic.
Correlation Between the Average Socioeconomic Status and Test Score by State
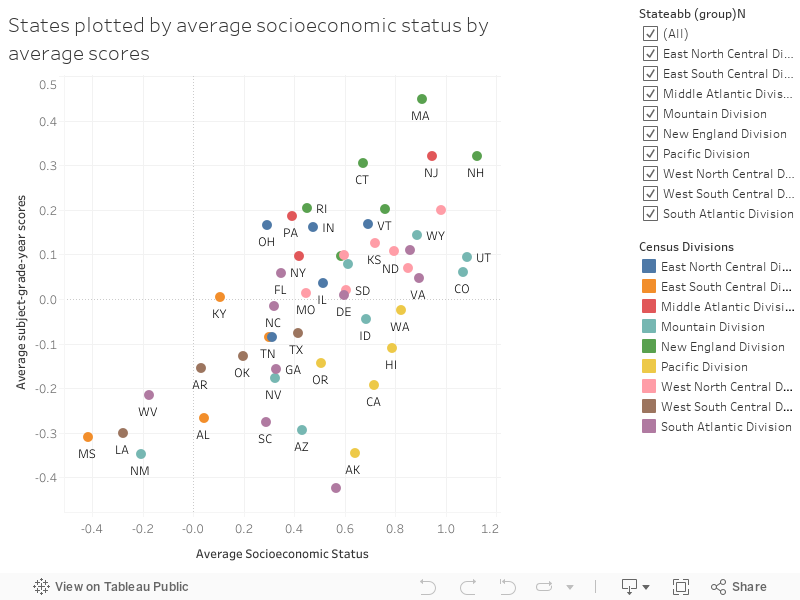
Graph 5. Created on Tableau. Scatterplot comparing socioeconomic composite scores to average test scores for each state.
Each dot in the plot represents a different state. It compares the average socioeconomic status of each state, and examines its correlation with the average subject-grade-year scores of the state. There is a fairly positive correlation, indicating that students living in states with better average socioeconomic statuses (i.e. less financial hardship, etc) generally perform better than states where students face more socioeconomic hardship. The plot shows that gaps in students’ academic performances varies in different states at least partially because of differences in the socioeconomic statuses in the states themselves. Gee affirms this and writes that gaps between students’ performances in subjects like math and reading widened due to the pandemic (Gee, 2023). The colors of the dots in the plot represent the state’s census division, such as the pacific division for states like California and Alaska. For divisions like the New England Division and the Mountain Division, they have relatively similar socioeconomic statuses and student academic performance, as seen by their proximity to each other on the plot. In the bubble plot from earlier, we can see these states are relatively different to each other in regards to racial diversity and urban/rural diversity. From this, we can see that even when states are racially diverse, the impact of socioeconomic status is more notable on students’ education. Educational policy is dependent on state policies and is largely left to the states’ governments, which affects students’ abilities to increase and improve their education (McLendon & Perna 2014). The role of socioeconomic status of a state impacts their funding. States with lower average socioeconomic statuses collect less taxes and therefore have less funding for their education programs. With COVID-19 having a harsh effect on the country and different states’ economies, the pandemic also impacted students across the country disproportionately, decreasing the quality of education for students in less fortunate states.